Smart City Monitor helps ‘s-Hertogenbosch gain insight into visitor flow during Carnival
Posted on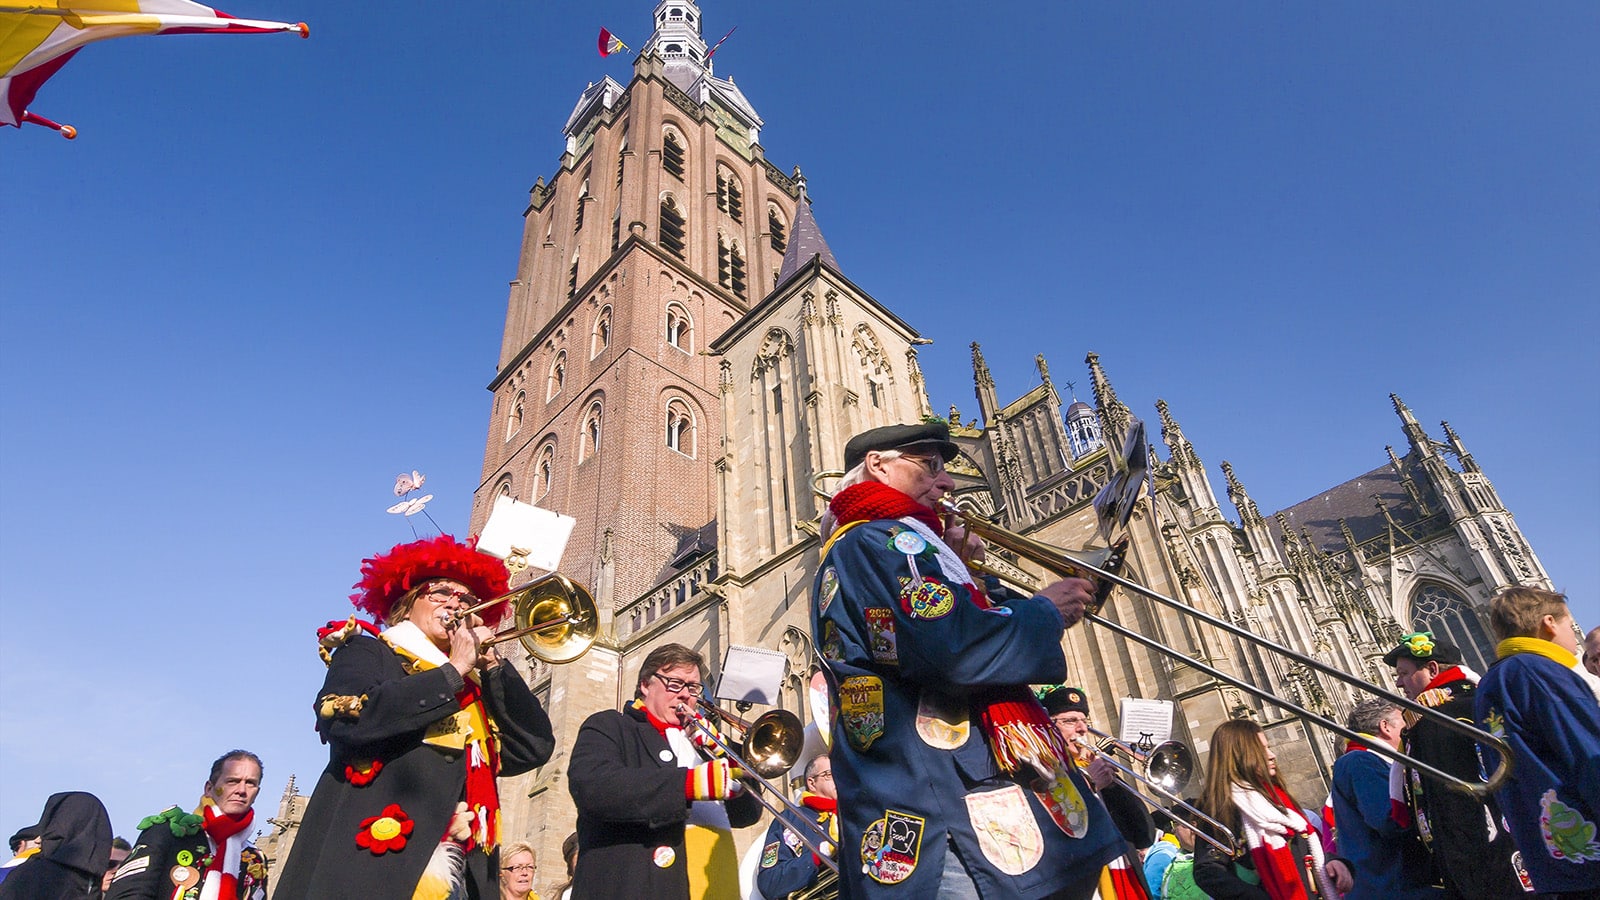
In ‘s-Hertogenbosch, the carnival season is opened on D’n Elfde van d’n Elfde (the Eleventh of the Eleventh)! A celebration during which the city of ‘s-Hertogenbosch expects many visitors. The Smart City Monitor project – in which JADS is a participant – collects data on the festivities of November 11 to get a good overview of the partying crowds in real time. Using this data, the municipality make simulations of crowds and visitor flows.
The data collected will be used for future events. For example, Carnival 2023; a celebration that will attract many people. During Carnival, there can be long queues and some places get very crowded which can cause dangerous situations. The data from the Smart City Monitor will help us anticipate and prevent these situations. For example by spreading different activities to different locations. The data collected does not contain personal data and is therefore not traceable to individuals.
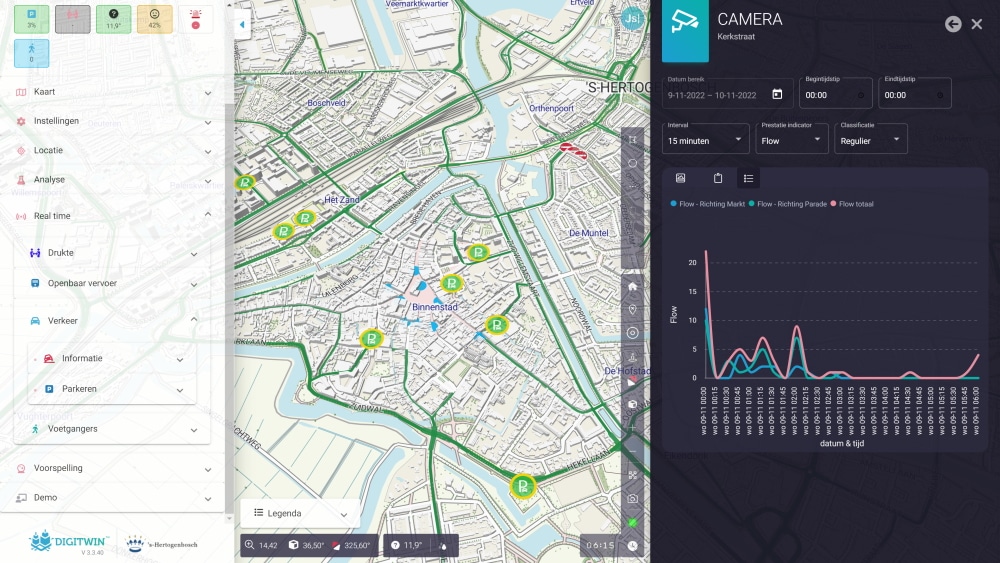
An example of the dashboard used (image: Argaleo)
Wethouder (alderman) Kâhya: “I believe you can make a difference with smart data applications. If you make smart use of the data that already exist – and connect them – then these insights help us do the right things. Using data can contribute to the quality of life and work in our municipality. For me, it’s not so much about the technology but much more about what you can do with it. Data must be at the service of our residents, entrepreneurs, visitors, students. We don’t do that alone. We work together with partners, education and business to create a healthy and vital downtown. I’m proud of that.”
Guide to Carnival
For those unfamiliar with the tradition of Carnival in The Netherlands, read this guide to the carnival season
MORE ATTRACTIVE AND ACCESSIBLE CITY CENTER (SMART CITY MONITOR)
![]()
![]()
Last year, the European Union made available more than 800.000 euros of funding for the Smart City Monitor project. The Smart City Monitor project will run until the end of 2023. The monitor aims to provide more insights into visitor and traffic flows in the city center. It will also provide data on, for example, how busy the city center is and how visitors experience this. In this way, various data can be connected. Smart use of this information helps to keep the city center attractive, healthy and accessible for everyone (especially after the corona crisis). Accessibility, sustainability and economy form the basis. With a threefold goal: to be able to visualize situations digitally in real-time, to gain insights into trends and developments and (in the near future) to be able to predict the effects of interventions (e.g. adjustments to public space). The development of this dashboard takes place in collaboration with the municipality of ‘s-Hertogenbosch, Jheronimus Academy of Data Science (JADS), Breda University of Applied Sciences (BUAS), Argaleo and Geodan.