Investigating food sustainability: the case of pizzas and croquettes
Posted on
What do pizzas have in common with milk chocolate bars? And what do croquettes have to do with the weather? The answer is that they all lie at the heart of two fascinating master’s research projects performed by JADS students, both of which revolve around the theme of food sustainability. Working in collaboration with Deloitte, one of the big four accountancy firms, Martijn Scheve has designed an interactive tool for mapping a product’s environmental footprint. Maaike van Delft, for her part, recently embarked on a study for an organisation called Wastewatchers, the aim of which is to find out how consumer food choices are affected by the weather – and by weather forecasts in particular.
Standing on your bathroom scales
Martijn Scheve explains how his project came about: “Well, I always wanted to do something that combined visualisation with sustainability. And a series of chats with people from Deloitte, most importantly Frans Geurts, Senior Specialist Lead Data Visualization, got me thinking about life-cycle assessment as a springboard for this.
Just imagine that you want to lose weight. You go and stand on your bathroom scales and you immediately see exactly how much you weigh. In other words, you can see how much weight you still need to lose – or indeed how much weight you’ve already lost. Lots of firms would like to become more sustainable in their production processes, but they don’t have scales that can tell them what their environmental impact is and how they can reduce it. Life-cycle assessments are like scales that measure the life cycle of a single product.”
“I chose milk chocolate bars and pizzas as examples for my tool, and assessed the complete life cycle of each ingredient from the farm to the consumer. What I didn’t want was to end up with a single graph, as that only shows the tip of the iceberg. I wanted to dive deep into the environmental impact of each ingredient to find out how it comes about. I was interested in things like CO2 emissions, water consumption and land use. That meant looking not just at primary processes, but also at secondary processes and sub-processes. For example I used the open Agribalyse database which contains data on the foodprint of different parts of the full food product systems and which was reviewed by the Dutch RIVM. It’s a massive mountain of data. There are specialized tools to combine that data, e.g. the open source tool openLCA that I use, allowing experts to determine the food print of individual products. However, because food supply lines are so long, even for experts it is difficult to get an overview of the different contributions, and in particular, where the bulk of the food print of that product is produced. My aim was to come up with an interactive tool that could visualise the whole system in a way that both experts and non-experts could easily understand.”
Impact Landscapes
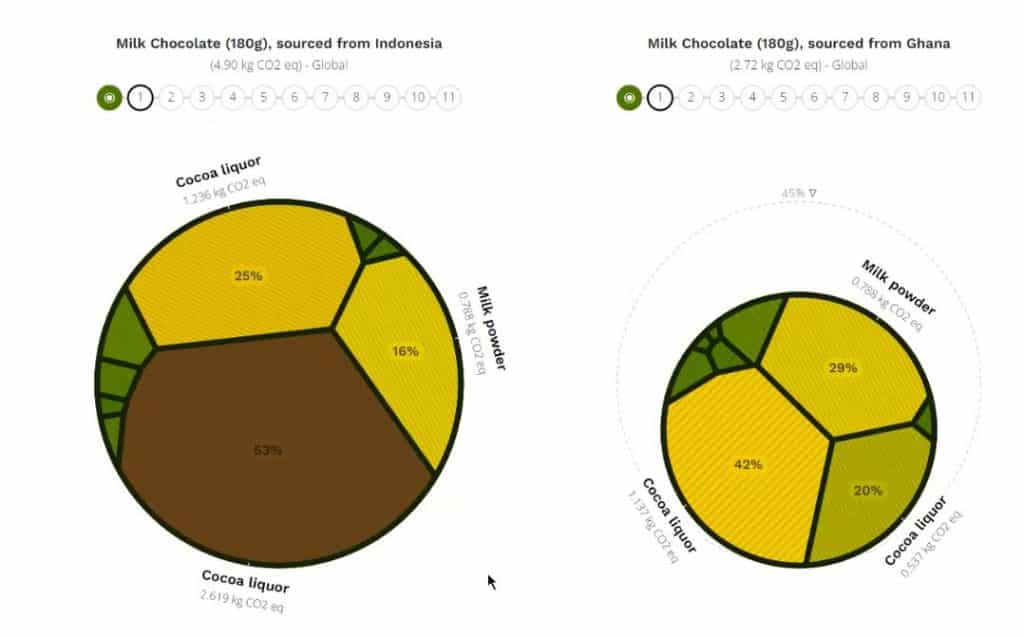
“My tool is called ‘Impact Landscapes’ and you can use it in two different ways. You can click on each field in one of the landscapes (see figure 1) and then zoom in on individual processes. Or you can click on the circles at the top. The data has been arranged as a sort of tree, and you can use the circles to move further along the branches. Here you can see two landscapes: the one on the left shows a bar of milk chocolate sourced from Indonesia, and the one on the right shows milk chocolate from Ghana.
“The circle for Indonesian chocolate is 45 per cent bigger than the circle for Ghanaian chocolate – and that’s precisely the difference in their overall impact. The field for cocoa liquor is brown, which means that the CO2 impact is higher than average – 53% in this case. If you click on the circles at the top, you’ll see that land use change is what accounts for the difference between the two countries. It’s the loss of primary forest in Indonesia that makes all the difference.”
Pizza Bolognese v. Pizza Margarita
Martijn also applied his tool to pizzas, where he found that the ingredients made a huge difference to the environmental impact. “A Pizza Bolognese, for example, has a much bigger impact than a Pizza Margarita. It’s the presence of beef that accounts for that.”
So, what’s the aim of his tool? “My aim is to visualise complex information so that decision-makers in firms and organisations can make better and more efficient choices. In many cases, the data’s already there. It’s simply a question of making use of it. I therefore made the tool available as open source software with same license as open LCA (Mozilla license).
Hedgerows
Martijn’s JADS & TU/e supervisors dr. Rogier Brussee and prof. dr. Jakob de Vlieg are brimming with enthusiasm. Rogier Brussee: “It’s an amazing visual tool. What Martijn has done is different from what most students do. In his case, it’s all about communicating the meaning of data to people, making clear where exactly there’s a problem, and where you can take action to reduce the impact of a given product. He has succeeded in producing an open-source tool that can be incorporated in any open life-cycle assessment. Not only that, but it actually looks like a typically English hedgerow landscape!”
Food sustainability is the name of the game, and this is where Martijn’s project ties in with Maaike van Delft’s work. Rogier Brussee: “Maaike is examining the influence of the weather on people’s food purchases. She’s doing this for an organisation called Wastewatchers, whose aim is to use data and innovative technologies to help food service companies reduce the volume of food waste. For Maaike, it’s not just a matter of how hot or cold it is, but also of whether people adjust their behaviour to the weather or to the weather forecast. In other words, do they react to the current state of the weather or to the future weather?”
Maaike herself also takes a keen interest in sustainability and climate change, and this is what attracted her to Wastewatchers. “They’ve collected masses of data from cash registers used by company canteens, hospital restaurants and care homes. They’d already concluded, by examining this data, that people are influenced by the weather, but that how it all works in practice is a very complex business. The assumption that I’m trying to test is that people are influenced at an early stage – in other words, by weather forecasts. It’s a matter of analysing weather data from the KNMI (the Dutch Meteorological Institute) and trying to establish whether there’s any correlation between weather variables and the food products people buy. Temperature is of course one of the main factors, but I’m also looking at things like wind chill and humidity.”
Deep fried Dutch kroketten and mustard for lunch
Croquettes and sandwiches
Maaike van Delft: “Croquettes are one of the products in my study. That’s partly because they’re a very well-defined product, but also because they tend to be sold in most institutional canteens. But I’m also looking at other hot snacks, salads, soup and sandwiches.”
Maaike only started her study fairly recently, and so has not been able to draw any conclusions yet. “I’ve spent this initial period on an exploratory data analysis: what exactly does the data contain? How is it all organized? What sort of things are interesting and what variables can I use? Wastewatchers have been collecting data ever since 2015, so they’ve got loads of useful stuff.”
Unique dataset
“Maaike’s project follows up on three previous master’s research studies into the way consumers adapt their food purchases to the weather. We found that most people are more likely to buy comfort food during a spell of bad weather than during a spell of good weather. But do they base their choices on the weather or on the weather forecast? Our impression is that weather variables account for between 15 and 30% of consumer choices and that the relative importance of the weather forecast compared with the actual weather tends to vary from one product to another. This is what Maaike is hoping to confirm.
The dataset that Wastewatchers had gathered is rather unique as it enables us to predict the consumer. Other datasets usually take the order data as the starting point which provides a less accurate picture of consumer behaviour and possible sources of food waste. Connecting this to weather data creates a powerful tool allowing companies to incorporate the weather in their business model.”
Thomas Luttikhold, Wastewatchers
For Rogier Brussee, though, data science is about more than just collecting data. “It’s all about working out what question you wish to answer. What data do you then need to answer that question as accurately as possible? If we want to reduce our footprint, and I think we should, we must methodically determine where we are squandering resources, and act to work much more precise. Precision is of the essence.”